OTIF: What "On Time In Full" Means and How to Measure It
OTIF is one number that answers two questions: did the order arrive when you said it would, and was everything on it? Here's the formula, the choices hiding behind it, and where a warehouse gets the data.


OTIF (On Time In Full) is the percentage of orders delivered inside the agreed delivery window and with the complete ordered quantity. The formula is orders delivered on time and in full, divided by total orders, times 100. An order that is late, short, or both counts as a miss, so OTIF is always equal to or lower than your on-time rate and your fill rate taken separately.
The formula is the easy part. The hard part is that "on time" and "in full" have no standard definition, and two companies can look at the same deliveries and report different scores. This guide covers the calculation, the definitions you need to pin down, what counts as a good score, and how to measure OTIF with data your dock already produces.
What does OTIF mean?
OTIF stands for On Time In Full, a delivery KPI that counts an order as successful only if it arrives within the agreed time window and contains the full quantity ordered. Both conditions have to be true for the same order. McKinsey's 2019 paper on the metric describes it as the extent to which shipments reach their destination according to both the quantity and the schedule on the order.
You'll also see it written as DIFOT (Delivery In Full, On Time). It's the same metric with the words in a different order, and DIFOT is the usual name in Australia and New Zealand.
OTIF became a boardroom number in 2017, when Walmart started charging suppliers for deliveries that were early, late or incomplete. Other large retailers run their own versions. But the metric isn't only for retail suppliers. A manufacturer can use it to score inbound suppliers, a wholesaler can use it to track its own service to customers, and a 3PL can report it to each client.
How do you calculate OTIF?
You calculate OTIF by dividing the number of orders delivered both on time and in full by the total number of orders delivered, then multiplying by 100.
OTIF % = (orders delivered on time AND in full ÷ total orders) × 100
A worked example. Say you delivered 200 outbound orders last month:
- 184 arrived on time, a 92% on-time rate.
- 190 arrived in full, a 95% in-full rate.
- 176 arrived on time and in full, so OTIF = 176 ÷ 200 × 100 = 88%.
Notice that 88% is lower than both component rates. That's how the metric behaves: the late orders and the short orders are mostly different orders, so the misses add up. As a rule of thumb, if lateness and shortages are unrelated, OTIF lands near the on-time rate multiplied by the in-full rate (0.92 × 0.95 ≈ 0.87). A team that is proud of "95% on time" and "95% in full" is probably running an OTIF of about 90%.
Should you count by order, line or case?
The unit you count changes the score more than most people expect. McKinsey's paper gives a clean illustration: a retailer orders 50, 30 and 20 cases across three order lines, and the supplier delivers 50, 30 and 10 on time.
- Case level: 90 of 100 cases arrived on time, so OTIF is 90%.
- Line level: 2 of 3 lines were complete, so OTIF is 66%.
- Order level: the order was not complete, so OTIF is 0%.
Same truck, same pallets, three different scores. In the McKinsey and Trading Partner Alliance survey of 24 large North American retailers and consumer goods manufacturers, 79% preferred case-level counting. McKinsey's argument for it is that it gives credit for a partial delivery that still helps keep the shelf stocked. Order-level counting is stricter and simpler, and it's common in manufacturing, where a missing component can stop a production line no matter how much of the rest arrived.
Neither is wrong. Pick one, write it down, and make sure your customer is using the same one.
What counts as "on time" and "in full"?
"On time" means the delivery arrived within a window both parties agreed in advance, and "in full" means the delivered quantity matched the order; the details of both are set by contract, not by any industry standard. In the same McKinsey survey, 92% of respondents agreed that an industry standard for OTIF would create value, which tells you there isn't one.
These are the choices that have to be made before anyone calculates anything:
| Decision | Common options | Why it matters |
|---|---|---|
| Reference date | Customer's requested date, supplier's confirmed date, or the booked dock appointment | 67% of surveyed companies preferred the requested ("must arrive by") date. Suppliers often measure against the date they confirmed, which flatters the score. |
| Size of the window | A full day, ±4 or ±6 hours around an appointment, one or two days early allowed | McKinsey found no consensus at all on window size. |
| Early arrivals | Counted as on time, or as a miss | Walmart counts deliveries that arrive before its must-arrive-by (MABD) window as a miss. About 25% of deliveries in the McKinsey data arrived more than two hours before their appointment, which jams the receiving dock. |
| Measuring point | Arrival at the gate, check-in, or unloading complete | Gate arrival is fairest to the supplier; delays after that are usually the receiver's. |
| Counting unit | Order, order line, or case | The same delivery scores 90%, 66% or 0% depending on the unit (see the example above). |
| Overdelivery and substitutions | Ignored, or counted as a miss | Extra or wrong product doesn't fill the order. |
| Receiver-caused delay | Excluded, or counted against the supplier | If the receiving warehouse had no appointment free on the requested day, the supplier shouldn't carry the miss. |
| Customer-arranged transport | Measured at delivery, or at the requested loading date | When the customer sends the truck, the supplier controls readiness at the dock and nothing after it. |
If a customer tells you your OTIF is 81% and your own report says 94%, the difference is almost always in this table, and it's worth a meeting before it's worth an argument.
What is a good OTIF score?
A good OTIF score is whatever your customer's contract says it is, and for most retail and industrial supply agreements that means somewhere from 90% to 98%. There is no audited, cross-industry benchmark. Software vendors' guides commonly quote 95% or higher as "good"; treat that as a rule of thumb and not as measured data.
Two reference points are better documented.
Reality is lower than the targets. McKinsey's 2019 paper put typical OTIF misses in the consumer goods sector at 20 to 30 percent of deliveries, and its breakdown of on-time losses across the order-to-delivery cycle ends at 61% actually on time. The figures are a few years old, but they're a useful check on anyone who says 98% is normal.
Walmart publishes the best-known targets. As of mid-2026, supplier guidance from 8th & Walton and SPS Commerce lists them as:
| Walmart measure | Target | Applies to |
|---|---|---|
| On time | 90% | Prepaid suppliers, who arrange their own freight to Walmart |
| Collect ready | 98% | Collect suppliers, whose freight Walmart picks up; the load must be ready on time |
| In full | 95% | All suppliers |
| Charge for non-compliance | 3% of the cost of goods on the non-compliant cases | All suppliers |
In practice, if $40,000 worth of cases fall outside the targets in a quarter, the deduction is $1,200. The 3% figure was confirmed by a Walmart spokesperson to Supply Chain Dive in 2019 and hasn't changed since; the thresholds have been revised several times since the program launched in 2017, so check Walmart's own supplier documentation before relying on them.
Outside the US, large retail chains and industrial buyers write the same idea into supply agreements as a service-level or delivery-reliability clause. The thresholds and penalties are specific to each contract, so there is no public number to quote. Read yours.
What's the difference between OTIF, OTD and fill rate?
On-time delivery (OTD) measures timing only, fill rate measures quantity only, and OTIF requires both for the same order. An order that arrives on schedule with two pallets missing passes OTD, fails fill rate, and fails OTIF.
| Metric | What it asks | What it ignores |
|---|---|---|
| On-time delivery (OTD) | Did it arrive inside the window? | Whether anything was missing |
| Fill rate (case or line fill) | How much of the ordered quantity was shipped? | When it arrived |
| OTIF / DIFOT | Did it arrive inside the window and complete? | Damage, paperwork, invoicing |
| Perfect order rate | On time, complete, undamaged, and with correct documents and invoice? | Nothing; it's the strictest of the four |
OTD and fill rate are still worth tracking, because they tell you which half of OTIF is failing. A low on-time rate points at transport, dock scheduling and order release. A low in-full rate points at inventory accuracy, picking and production planning. Different problems, different owners.
What causes OTIF misses?
OTIF misses come from every step between order release and the receiving dock, and a large share of them happen before the truck has left the shipper's yard. McKinsey's breakdown of on-time losses lists seven stages: order release, tender creation, tender acceptance, dock schedule, goods staged, carrier pickup, and transportation. Only the last one happens on the road.
Causes that fail the on-time half:
- No loading slot is free when the truck needs to leave (shipper's dock).
- Goods aren't picked, staged or released when the truck arrives (shipper's warehouse).
- The carrier arrives late for pickup, or the load has to be re-tendered (transport planning).
- The truck waits hours to unload (receiver's dock).
- The truck arrives early and is turned away or left to wait, usually because there was no appointment.
Causes that fail the in-full half:
- Stock that exists in the system isn't on the shelf (inventory control).
- Picking or loading errors (shipper's warehouse).
- Production runs behind the order date (planning).
The dock shows up on both ends. At the shipper, a truck that can't get a loading slot leaves late. At the receiver, a truck that arrives on time but waits three hours to unload gets stamped late in some customers' systems. ATRI's 2024 detention study found that drivers were detained at 39.3% of stops, which is the same problem seen from the driver's seat. We covered that side in what is truck detention.
How do you measure OTIF at the dock?
To measure OTIF you need four data points for every order: the agreed delivery window, the actual arrival time, the ordered quantity and the delivered quantity. The two time values come from your dock schedule. The two quantity values come from your ERP or WMS. OTIF is what you get when you join them on the order reference.
| OTIF input | Where it comes from | How it's captured |
|---|---|---|
| Agreed window | Customer order or contract; the booked dock appointment | Order system; the slot the carrier booked |
| Actual arrival | Gate or office check-in | Loading status changes to arrived, with a timestamp and user |
| Loading or unloading time | The dock team | Status changes to in progress, then done |
| Ordered quantity | Purchase or sales order | ERP / WMS |
| Delivered quantity | Goods receipt, or the signed CMR or bill of lading | WMS; the document attached to the loading |
| Reason for a miss | Planner or dock supervisor | A short reason code per failed order |
A word on what dock scheduling software does and doesn't do here. LoadingCalendar records the time half: when the slot was booked, when the truck arrived, when loading started and finished, and who changed what, all in an audit log. It doesn't know how many cases were on the order. For the full OTIF figure you match the loading reference against your order system, either by export or through the dock scheduling API, which returns loadings by date range, status and reference.
A setup that works for a mid-size warehouse:
- Write the definition on one page. Reference date, window, counting unit, how early arrivals and receiver-caused delays are treated. Get your biggest customer or supplier to agree to it.
- Put every truck on an appointment. Without a booked slot there is nothing to be on time against. A carrier booking portal lets carriers pick the slot themselves, which also keeps the reference number attached to the booking.
- Timestamp arrival, start and finish. Moving a loading through its statuses does this without anyone filling in a form.
- Record quantity at the dock. Received versus ordered for inbound, loaded versus ordered for outbound.
- Give every miss a reason code. Five or six codes are enough: carrier late, carrier early, dock not free, goods not ready, short shipped, wrong product.
- Report weekly, and split the number. Show OTIF, on-time and in-full side by side, per carrier and per supplier or customer.
Track appointment adherence as well. Many contracts measure "on time" against the requested date, so a truck that is three hours late for its slot still passes OTIF that day. It also wrecks the rest of your schedule. The share of trucks arriving within, say, 30 minutes of their booked slot is the early warning; OTIF is the result you see later.
One more distinction. For inbound freight you are the one measuring suppliers, and your dock timestamps are the evidence. For outbound freight you are the one being measured, and when the customer arranges the transport, your score depends on the load being staged and the dock being free at the requested loading time. Walmart calls this "collect ready", and it's entirely a warehouse metric.
How do you improve OTIF?
You improve OTIF by finding which half fails more often and fixing the single biggest cause on that side. The reason codes from the previous section tell you where to start, usually within a month.
If on-time is the weaker half:
- Spread arrivals with appointments. Bunched trucks mean late departures at the shipper and long waits at the receiver. Fixed slot intervals cap how many trucks can turn up in the same half hour.
- Match slot length to the real job. A full truckload booked into a 30-minute slot pushes every truck behind it. Set loading durations per load type and the calendar stops lying. See time slot management.
- Use lead time to stage the load. A minimum booking notice of a few hours means the pick is finished and the paperwork printed before the truck backs in.
- Make double-booking impossible. Two trucks assigned to one door guarantees one late departure. We wrote a separate guide on how to stop double-booking warehouse docks.
- Confirm the delivery appointment when the order is placed. McKinsey calls this an emerging best practice, and it removes the "no slot available on the requested day" miss almost entirely.
If in-full is the weaker half, the work is mostly away from the dock: cycle counts on the items that short-ship most, a check at the loading door, and honest promise dates when production is behind. Dock scheduling won't fix a stockout.
To put a cost on the waiting side of the problem, the dock scheduling ROI calculator uses ATRI's figures and shows its assumptions. If you're new to the topic, start with what is dock scheduling. LoadingCalendar costs €99 per month flat for unlimited docks, users and carriers, with a 14-day trial and no credit card. It suits small and mid-size warehouses that want appointments and timestamps running this week. A supplier shipping to dozens of retail distribution centers will also need an EDI and retail compliance tool, which we are not.
Frequently asked questions
Sources
- McKinsey & Company (Davies, Lal, Perez, Potdar), "Defining 'on-time, in-full' in the consumer sector" (June 2019), reporting a survey by the Trading Partner Alliance and McKinsey: definition of OTIF; survey of 24 North American retailers and CPG manufacturers (92% agree an industry standard would create value, 79% prefer case-level counting, 67% prefer the requested delivery date, no consensus on delivery window); about 25% of deliveries arriving more than two hours before their appointment; OTIF misses of 20 to 30 percent; order, line and case example; the seven stages of on-time loss with 61% actual on-time performance. mckinsey.com
- Retail Dive (March 2019), citing Walmart's statement to sister publication Supply Chain Dive: Walmart spokesperson confirming the 3% cost-of-goods charge; OTIF first implemented for suppliers in 2017. retaildive.com
- Walmart's current OTIF targets (90% on time for prepaid, 98% collect ready, 95% in full, 3% of cost of goods on non-compliant cases), as reported by 8th & Walton (updated June 2026) and SPS Commerce (2025). Walmart revises these thresholds; verify against its supplier documentation. 8thandwalton.com, spscommerce.com
- American Transportation Research Institute (ATRI), 2024 truck driver detention study: drivers detained at 39.3% of stops in 2023. truckingresearch.org
- The 200-order worked example and the $40,000 deduction example are illustrative arithmetic, not measured customer data.
You might also like
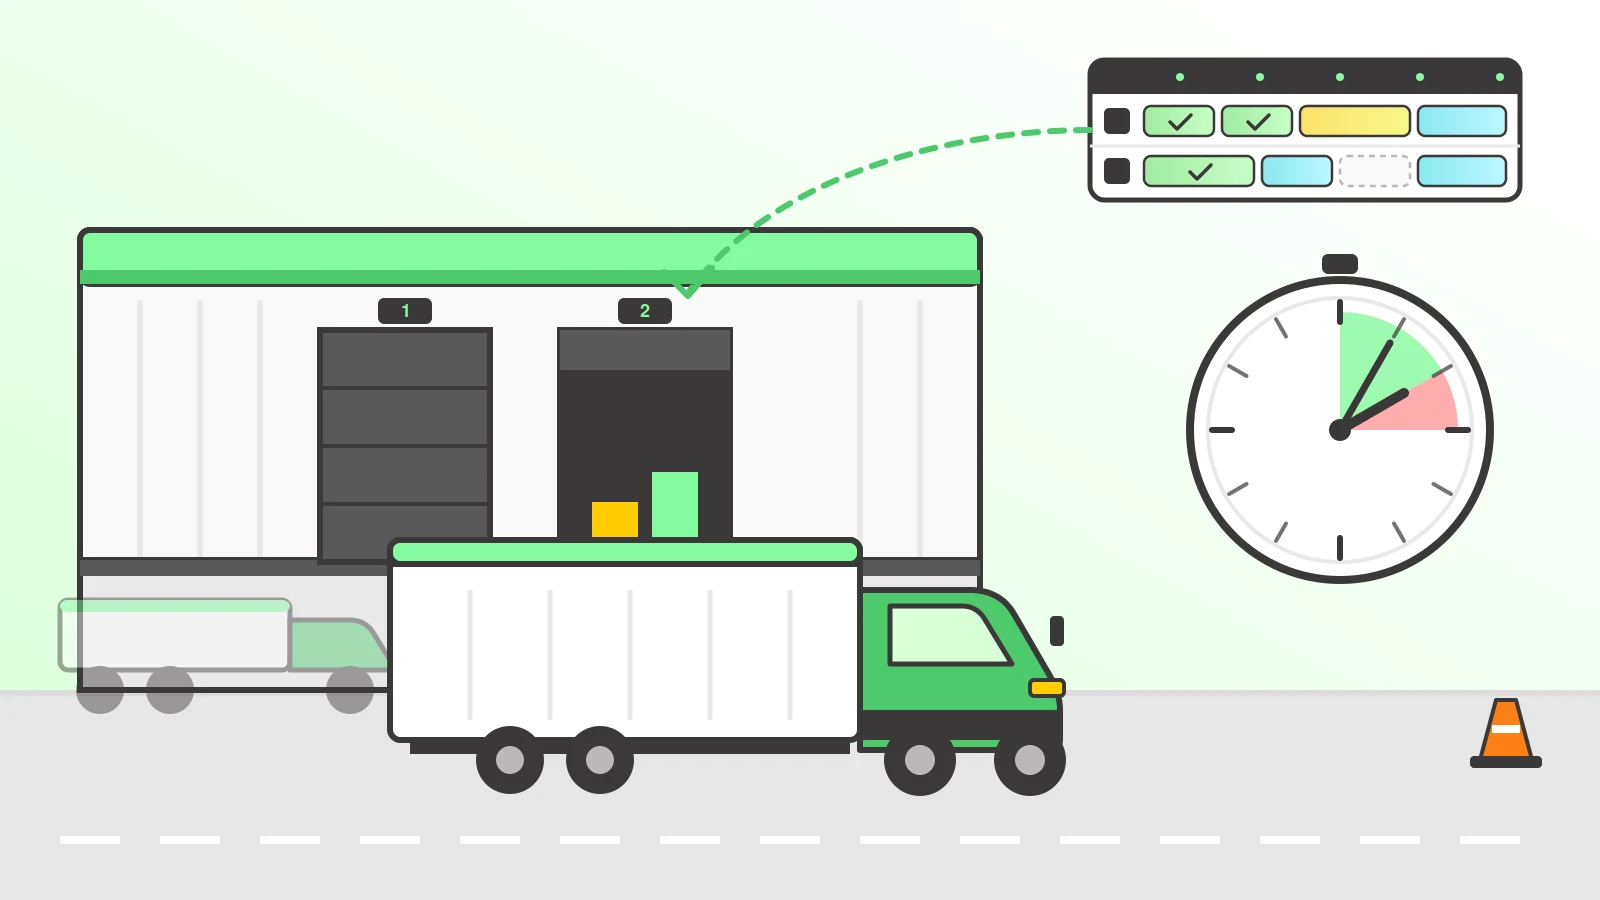
How to reduce detention fees: put every truck on an appointment, match slot lengths to real loading times, and log arrival, dock-in and departure automatically.
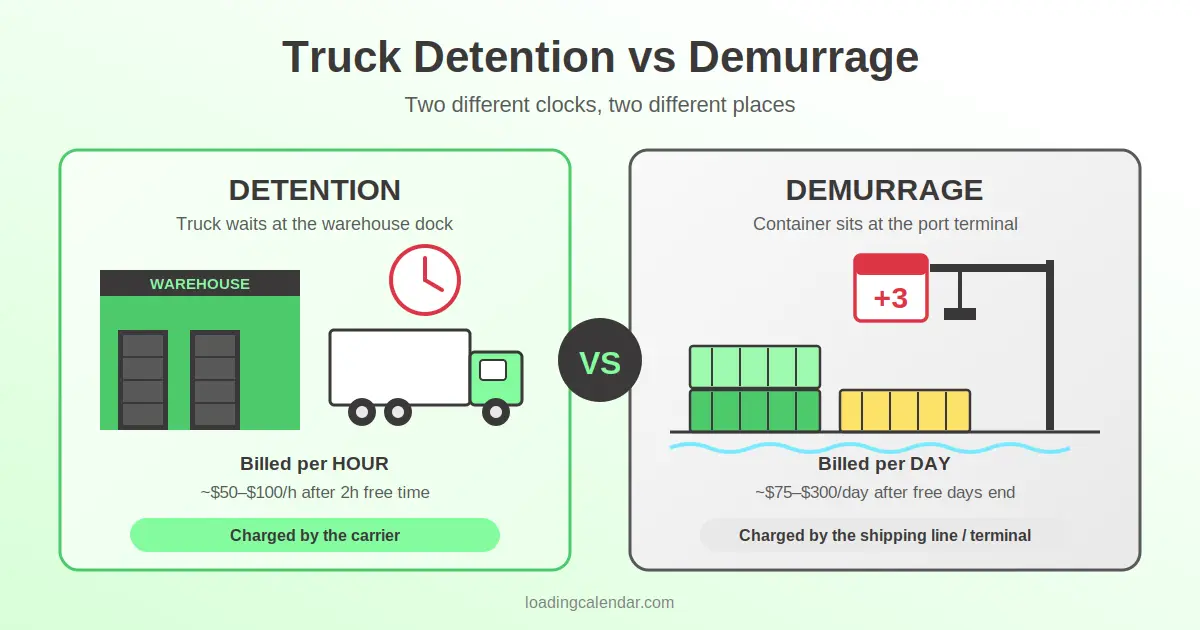
Truck detention is the fee carriers charge when drivers wait past free time — typically $50–$100/hour after 2 hours. Demurrage is a daily port charge. Here's the difference, who pays, and how to avoid both.
![How Much Does Dock Scheduling Software Cost? [2026 Pricing Comparison]](/assets/blog/dock_scheduling_software_cost-8463ea4974f5bc10aa183dee2e5f8c8139acfed8804ad040f32985c7e3080efb.webp "How Much Does Dock Scheduling Software Cost? [2026 Pricing Comparison]")
How much does dock scheduling software cost in 2026? Every vendor's price with sources — from $0.55 per booking to $15,000+ per year, compared side by side.
Ready for simpler warehouse scheduling?
Join warehouse teams across the world that replaced spreadsheets and phone calls with simple dock appointment scheduling software.
Start My Free Trial 14-day free trial · No credit card required · Cancel anytime